Some vaccinated people are getting COVID. What does this mean?
Delta is here and headlines are reporting the rise in new cases and hospitalizations, including some who have been fully vaccinated. What does this mean? Does the fact that some vaccinated people are getting sick mean the vaccines aren’t working?
Some breakthrough infections are expected
Thankfully, no. Even if a vaccine prevents 99% of infections, it is not 100% perfect. This statement should be obvious, but let it sink in for a moment. There are no vaccines that perfectly prevent every single infection, and this is to be expected. If a vaccine prevents 99% of infections, then there is 1% that it doesn’t prevent. Sometimes there are clear reasons why a vaccine might not protect everybody — for example if someone is immunocompromised, their body might not form as strong as an immune response to the vaccine, which means they may not have enough immunity to protect them from getting COVID.
So how many breakthrough infections should we expect? Well, it depends on the population and how many people are vaccinated. This is where things can start to get counterintuitive, but I promise you it’s simple math and fractions. Here are a few examples.
Let’s say there is a population of 1,000,000 people, and today, 5% of them were exposed to SARS-CoV-2 (1,000,000 x 5% exposed = 50k people exposed). Now let’s say only 10% of them are vaccinated, so we have 50k exposed x 10% vaccinated = 5k vaccinated people exposed. In this hypothetical example, let’s say that the vaccine prevents 99% of infections, and without vaccination, everybody who gets exposed becomes infected. How many breakthrough infections (infections in vaccinated people) would we expect? If there are 5k vaccinated people exposed and the vaccine prevents 99% of infections, then we would expect 5k x 0.01 = 50 breakthrough infections. When you’re looking at large groups of people, even when vaccines work very, very well, we do expect some breakthrough cases. These cases do not mean the vaccines aren’t working, they just mean the vaccines aren’t absolutely perfect (which we already knew).
If cases go up, breakthrough infections go up
Now let’s mess around with these numbers a little bit. Let’s say a more contagious variant has come through and instead of having 50k people exposed today, 100k people are exposed. What do we expect to happen to breakthrough infections? Let’s assume that the percent of the population that’s vaccinated remains the same at 10%. So we have 100k exposed x 10% vaccinated = 10k vaccinated people exposed. The vaccine is still preventing 99% of infections, so we would expect 10k x 0.01 = 100 breakthrough infections. So even though vaccine efficacy is unchanged, because more people were exposed, we got more breakthrough infections. Increasing numbers of breakthrough infections does not necessarily mean the vaccines are working less well, it might just mean that more people are getting exposed to the virus.
If vaccinations go up, breakthrough infections can go up
Alright, now for the most counterintuitive piece. What happens if instead of 10% of the population being vaccinated, 90% is vaccinated? And let’s use all the same assumptions from the last example: 100k are exposed and the vaccine prevents 99% of infections. We would get 100k exposed x 90% vaccinated = 90k vaccinated exposed. The vaccine is still preventing 99% of infections, so our breakthrough infections would be 90k x 0.01 = 900 breakthrough infections. That’s way higher than the last example! Why is it higher? Not because the vaccines are working less well, not because the virus is more contagious, but simply because there are more vaccinated people. So counterintuitively, if the virus is still circulating in a population, a higher vaccination rate will lead to higher numbers of breakthrough infections, because the overall number of vaccinated people has gone up.
Once we reach herd immunity, that will no longer be the case, as the high level of vaccinations will slow the spread of the virus, leading to fewer cases overall (and thus fewer breakthrough cases). But until we reach that point and the spread of the virus is increasing, breakthrough cases will also increase.
In summary, the number of breakthrough infections is not only dependent on vaccine efficacy, but is also determined by other variables, including:
- The number of people exposed to the virus
- The percent of a population that is vaccinated (counterintuitively)
Percent of hospitalizations who are vaccinated is an unreliable metric
Alright, you made it this far. Ready for some more math? Here we go.
A lot of headlines are reporting COVID hospitalizations and listing the percent of the hospitalized patients that were fully vaccinated. Hearing something like ‘15% of hospitalized COVID patients were fully vaccinated’ is alarming, right? It makes it sound like maybe the vaccines aren’t working that well? While I get why this is a tempting statistic to report, it is actually a very unreliable metric to use to figure out how well the vaccines are working. That statistic is influenced by a whole lot of variables, only one of which is vaccine efficacy. Here’s another hypothetical example to show why this is true.
Let’s say there were 100,000 people all exposed to SARS-CoV-2 on the same day. And let’s say that for those who are unvaccinated, the risk of hospitalization is 10% (10% of unvaccinated who are exposed will end up in the hospital), while the risk of hospitalization for vaccinated people is only 0.5%.
First, let’s figure out what the vaccine efficacy would be in this example. Vaccine efficacy for hospitalization is calculated as:

Said in words, it measures how much a vaccine reduces the risk of a bad outcome relative to that risk in an unvaccinated individual. If this is a little hard to wrap your head around, don’t worry, just trust the math. For our hypothetical example, the vaccine efficacy is (10% – 0.5%)/10% = 95% efficacy. For someone who has been vaccinated, the relative risk of hospitalization has been reduced by 95% compared to an unvaccinated individual.
Now let’s look at the number that headlines like to report (but is an unreliable way to assess how well the vaccines are working): the fraction of hospitalizations that were fully vaccinated.
This is calculated as:

While this fraction may seem to intuitively capture how well the vaccines are working, it very much does not.
To see why, let’s break it down into two parts: the numerator (the top part of the fraction) and the denominator (the bottom part of the fraction). I know you remember this from elementary school, but what are two ways to make a fraction go up? Either the numerator goes up, or the denominator goes down. For this statistic, both of these can happen without the vaccine efficacy changing one bit, which is why it’s an unreliable metric to use.
The numerator
The numerator is defined by the total number of vaccinated people who have been hospitalized. This is different from the numerator in the vaccine efficacy calculation as it is not the risk of hospitalization, it is just the raw number of hospitalizations. Unlike vaccine efficacy, it does not take into account how many people were exposed leading to those hospitalizations. This leads to problems.
For example, as we saw before, if a higher percentage of the population is vaccinated (and all other variables are held constant, including the number of people exposed), this will lead to more breakthrough infections, simply because there are more vaccinated people. Because of this, a higher percentage of vaccinated people in the population can counterintuitively lead to higher numbers of vaccinated hospitalized patients. I know this is very hard to wrap one’s head around, so here’s a visualization:
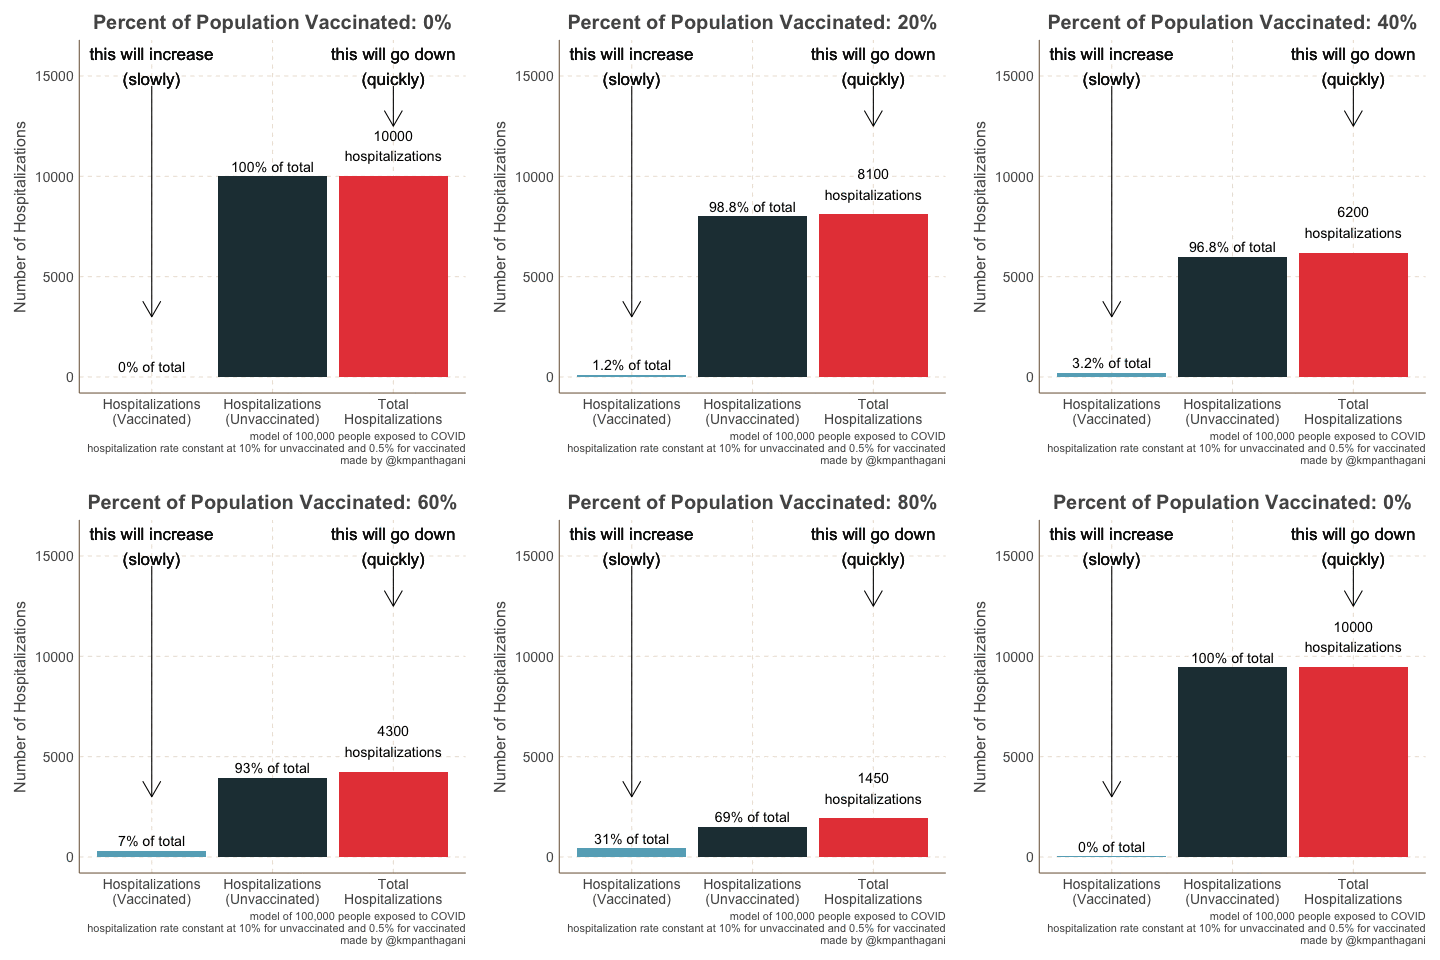
This is our hypothetical example where 100,000 people are exposed to COVID all at once, and the risk of hospitalization for the vaccinated is 0.5% and for the unvaccinated is 10%. The only thing that is changing in this graph is the overall percent of the population who is vaccinated (listed at the top of the graph); the number of COVID exposures and the vaccine efficacy are not changing. The height of the bars represent the raw number of hospitalized people in each group, and the labels (for the left two bars) show those numbers as a percent of total hospitalizations. The label on the left above the light blue bar shows the percent of hospitalizations who are vaccinated: this is the unreliable metric we’ve been talking about. (Please note so no one gets confused, this is an overly simplified model that is meant to illustrate concepts, not predict specifics of real world data.)
So what happens to that light blue bar as vaccinations go up? As the percent of the population who is vaccinated rises, the number of vaccinated people who are hospitalized goes up (height of light blue bar), simply because there are more vaccinated people overall. The degree of protection the vaccine provides does not change in this example. Only the percent of the community who are vaccinated is changing. The height of that light blue bar is the numerator in the unreliable fraction we’ve been discussing, and if the numerator increases, the fraction (the label above the light blue bar) will increase. This means that as more people in a population get vaccinated, all else being equal, the percent of hospitalizations who are vaccinated will go up, even though total hospitalizations are going down.
The denominator
Now let’s look at the denominator of the unreliable fraction: total COVID hospitalizations (the red bar). Remembering fractions, if the denominator goes down, the fraction goes up. What can make total hospitalizations go down? You guessed it: more vaccinated people. And that is what we see in this example: as the percent of the population that is vaccinated goes up, total hospitalizations go down, counterintuitively driving the % vaccinated hospitalizations even higher!
But at the very end of the graphic, it finally becomes intuitive. What happens when 100% of the population becomes vaccinated? 100% of hospitalizations must be vaccinated people, because there aren’t any unvaccinated people. “100% of hospitalizations were vaccinated” may sound scary, but it is misleading and not the right thing to look at. When the graphic gets to the point where 100% of people (and hospitalizations) are vaccinated, total hospitalizations is at its lowest point. And that is what we really care about: total hospitalizations.
This is why looking at the percent of hospitalizations who are vaccinated is not a good way to assess vaccine efficacy. It is impacted by multiple variables including the vaccination rate in the community as well as any other variable that impacts the total number of hospitalizations. For example, what if elderly people are vaccinated first, then younger people are vaccinated later? In this scenario, as more people are vaccinated, the risk of unvaccinated people being hospitalized would drop, not due to anything inherent about the vaccine, but due to the dynamics of vaccine rollout (i.e. as vaccination progresses, the remaining unvaccinated are younger, and thus at lower risk for severe COVID). If the risk of hospitalization for the unvaccinated decreases, then: the total number of hospitalizations decreases, the denominator decreases, and the percent of hospitalizations who are vaccinated increases (even though the raw number of vaccinated hospitalized people is unchanged). I know that’s a lot, so here’s another graphic.
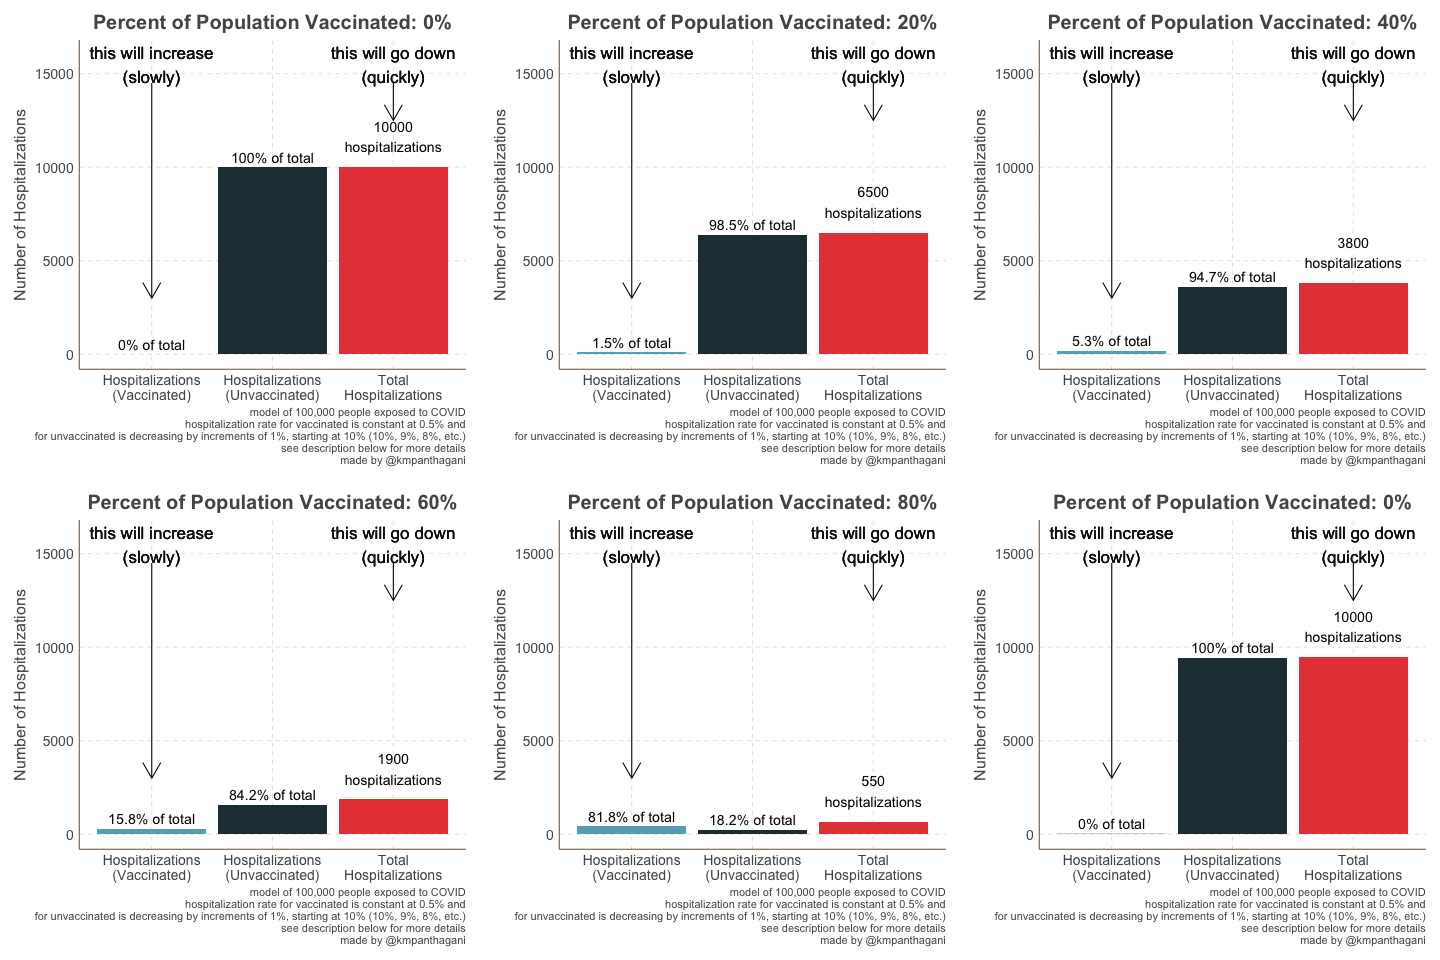
In this graphic (again a hypothetical scenario), to make things simple, the risk of hospitalization after vaccination stays constant at 0.5%, just like it was in the last example. However I made it so that as the rate of vaccination increases in the community, the risk of hospitalization for the unvaccinated decreases by 1% every time (it starts at 10% when nobody is vaccinated, then drops to 9% when 10% are vaccinated, then 8% when 20% are vaccinated, etc.). Please note this is an overly simplified simulation that is only meant to help you understand numbers and isn’t meant to model any specific real world situation.
If you compare it to the last graph, you will see that the height of the light blue bar (representing raw number of vaccinated hospitalizations) is identical. This makes sense, because the risk of hospitalization after vaccination is unchanged from the last example (it’s still 0.5% the whole time). But if you look at the label above the light blue bar, that is different compared to the last time: the fraction increases faster. Why? Look at the red bar: total hospitalizations drop faster compared to the last example. And because total hospitalizations is the denominator of the unreliable fraction, if they decrease faster, the fraction increases faster, even though the total number of vaccinated people who were hospitalized is unchanged.
This is an oversimplification because in the real world, if the demographics of the vaccinated group are changing as more people become vaccinated, you might expect the average risk of hospitalization for the vaccinated group to change as well (whereas in this example, it is held constant at 0.5%). Despite this simplification, the graphic still illustrates the overall point: if there are underlying demographic differences between the vaccinated and unvaccinated groups that impact their risk of hospitalization, then these differences in demographics can influence the fraction of hospitalized patients who are vaccinated, independently of any true change in how well the vaccine is working.
So, are the vaccines working?
So all that to say, figuring out how well the vaccines protect against the delta variant is complicated, and it takes more than looking at the percent of infections, hospitalizations, and deaths who have been vaccinated. To really figure it out, you have to take into account the overall number of people who have been vaccinated, how many people have been exposed (i.e. how fast delta is spreading through a community), the differences in age and underlying risk factors between vaccinated and unvaccinated groups, etc. That’s more than can fit in a headline, but if these variables aren’t considered, then it can lead to misleading conclusions.
So are the vaccines still working, even with delta circulating?
Yes. The figure below is a nice, big-picture way to visualize it: compare total cases to total deaths. In the past (pre-vaccination) era, every time cases went up (blue), deaths went up (red). But now in countries where a sizable portion of the country is vaccinated (UK and Portugal in this example), in recent weeks as cases have gone up, deaths have not gone up nearly to the same degree. The same is not seen for countries with low vaccination rates.
Poorer countries with low vaccination rates face a surge in Covid cases and deaths as the Delta variant takes hold https://t.co/hnyoaTwNNj pic.twitter.com/261J1hLCPQ
— FT Data (@ftdata) July 19, 2021
If you’re looking more for specific numbers on vaccine effectiveness against delta, here’s a nice summary of some of the studies so far. A study published today in the New England Journal of Medicine assessing the effectiveness of the Pfizer vaccine against the delta variant found that vaccine effectiveness was 88% against symptomatic disease, while effectiveness against the alpha variant was 94%. A not yet peer-reviewed study assessing the delta variant found that the Pfizer vaccine was 96% effective against hospitalization. Check out this article for more details on other vaccines and variants. As delta continues to surge, I’m sure we will continue to have more analyses looking at vaccine effectiveness in the coming weeks.
Delta is serious, and there will be some breakthrough infections. But this does not mean the vaccines aren’t working. The vaccines don’t completely eliminate the risk (as no vaccine ever does), but they do greatly reduce it. To figure out precisely how much they reduce the risk takes more than simple headlines, but requires nuanced, complex analyses that take into account many different variables, some of which may seem counterintuitive. And thankfully, so far the data has shown that the vaccines significantly reduce the risk of severe disease, even against delta. If you haven’t already, please look into getting vaccinated. The benefits of vaccination far outweigh the risks.

