A scientist looks at the COVID vaccine data

Trying to decide if you’re going to take the COVID vaccine? Me too. And I decided the best way to make that decision was to look through the data. I figured there are a lot of people like me who want to understand the data for themselves. So if that’s you, check out this hand-animated walk through of the Pfizer COVID vaccine safety and efficacy data.
Updates:
- There is now data showing that the mRNA vaccines also reduce asymptomatic infection.
- There is low concern for long-term side effects.
- Learn more about breakthrough infections.
A big thank you to Dr. Peter Hotez, MD, PhD for taking the time to answer some questions for this video!
Minor notes:
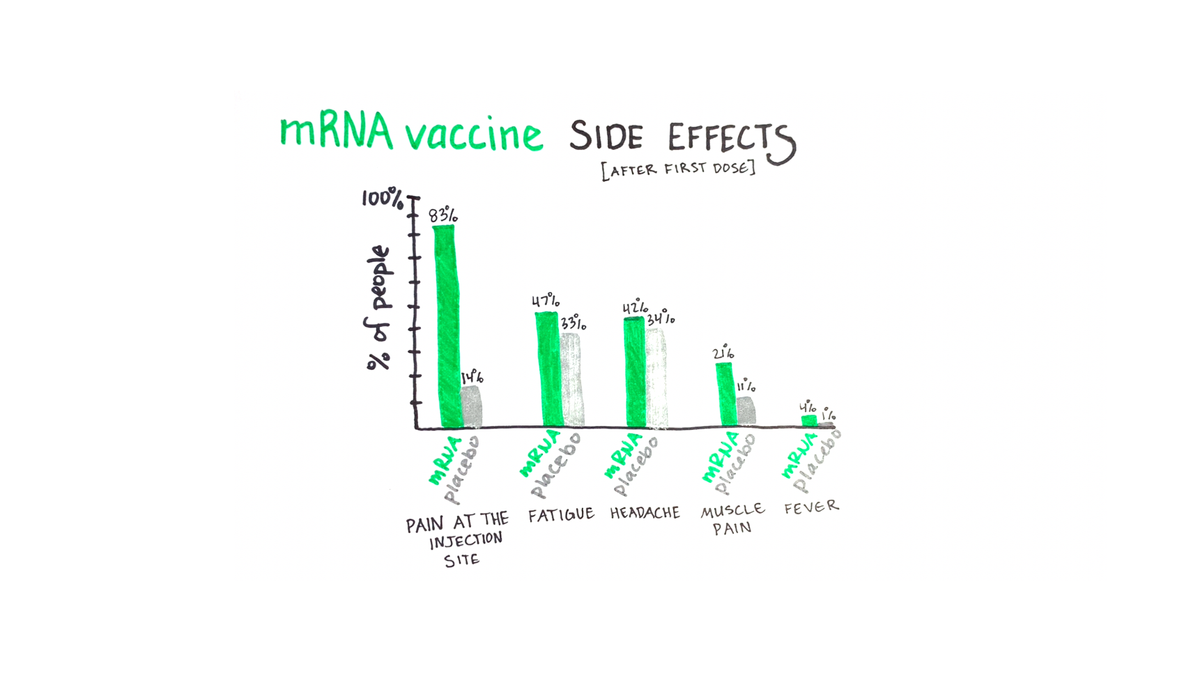
Side effects shown at @3:48 are common side effects for ages 16-55 after Dose 1. Side effects were generally lower for age 55+, and higher after Dose 2 for both age groups. I didn’t want to overwhelm people with graphs so didn’t draw out every single one; see all side effect data here. If you’re curious why the participant numbers @1:52 and @7:09 don’t perfectly match, see Figure 1 here.
Erratum:
@9:13 Vaccine efficacy of 95% indicates that the relative risk of getting COVID is reduced by 95% with vaccination relative to placebo.


